Tracking expenses is only useful if you actually look at the data and change your behavior. Spensy doesn't just store your receipts — it turns them into spending analytics that show you exactly where your money goes, how it's changing over time, and where you can cut back.
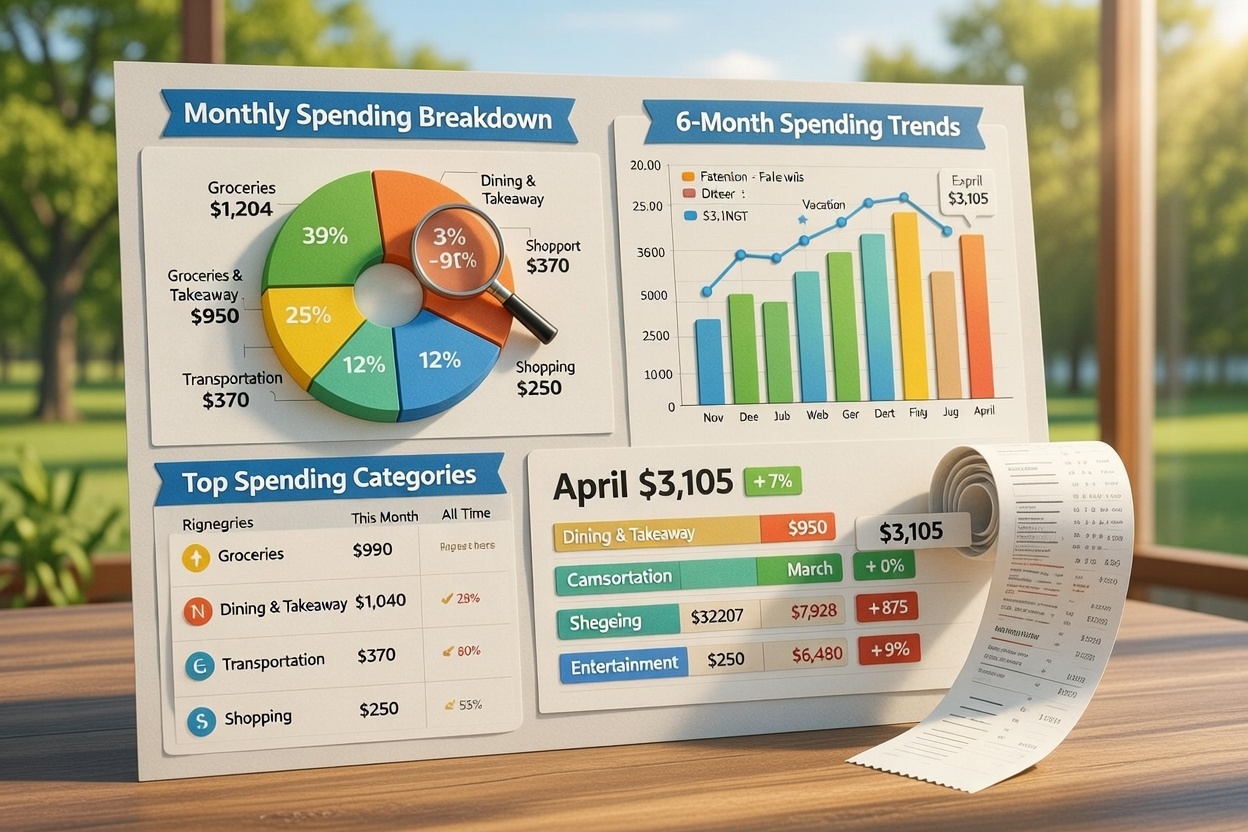
Monthly Spending Breakdown by Category
The first thing you'll see in Spensy's reports is your monthly spending broken down by category. Each category shows:
- Total amount spent — the sum of all receipt items in that category for the current month
- Percentage of total spending — how much of your overall monthly spend went to each category
This immediately answers the question "where is my money going?" If 40% of your spending is on Dining & Takeaway and you thought it was closer to 15%, that's a signal to pay attention to. The data replaces guesswork with facts.
6-Month Spending Trends
A single month's data is a snapshot. Spensy's 6-month trend chart shows your total spending for each of the last 6 months, so you can spot patterns:
- Are you spending more each month, or has it stabilized?
- Did a specific month spike? What happened — a vacation, a car repair, holiday shopping?
- Is your spending seasonal? Some people spend more in December and less in January. The trend chart makes this visible.
Trend data is what turns one-time tracking into long-term financial awareness. You stop reacting to individual expenses and start seeing the bigger picture.
Top Spending Categories
Spensy ranks your spending categories from highest to lowest for both the current month and all time. This gives you two views:
- Current month — what's eating your budget right now? Maybe you're on track with groceries but over-spending on entertainment.
- All-time — across all the data you've tracked, which categories consistently take the biggest share? This is where structural changes (like switching grocery stores or cooking more) can have the most impact.
Grocery Subcategory Breakdown
For most people, groceries are one of the largest spending categories. Spensy goes deeper here with subcategory tracking. When the AI categorizes a grocery receipt, it doesn't just label everything "Groceries" — it breaks items into subcategories:
- Produce — fruits, vegetables
- Dairy — milk, cheese, yogurt
- Meat — chicken, beef, fish
- Pantry — canned goods, pasta, rice
- Beverages — coffee, juice, sodas
- Frozen — frozen meals, ice cream
This lets you see which grocery subcategories drive your spending. If you're spending $200/month on beverages and didn't realize it, the subcategory breakdown makes it obvious.
Month-Over-Month Comparison
Spensy shows you your current month's spending alongside last month's total, so you can compare at a glance. Are you up or down? If you set a goal to reduce dining spending by 20%, the comparison tells you immediately whether you're on track.
Combined with per-category budgets, this becomes a feedback loop: you set a target, track against it, compare to last month, and adjust. Over time, this is how spending habits actually change.
Data Quality: Know When to Review
Analytics are only as good as the data behind them. Spensy's reports include data quality indicators that flag potential issues:
- Uncategorized items — items that the AI couldn't confidently categorize and need manual review
- Unverified receipts — receipts that have been processed by AI but not yet reviewed by you
- Amount mismatches — receipts where the item totals don't add up to the receipt total
Reviewing these flagged items before running reports ensures your analytics reflect reality, not AI guesses.
Exporting Your Data
Need your expense data in a spreadsheet? Spensy's CSV export includes every field: date, merchant, total, category, individual items, and receipt status. You can filter by date range and category before exporting, so you get exactly the data you need.
This is useful for tax preparation, expense reimbursement, or simply keeping a local backup of your financial data.
Start Tracking Your Patterns
The more receipts and statements you upload, the richer your analytics become. Start with a week's worth of receipts and you'll already see your category breakdown take shape. After a full month, you'll have actionable data to make real changes.
Spensy's free trial gives you 14 days and 10 receipt scans to explore the analytics dashboard. No credit card required.